Goal and Background
The main purpose of this lab was to introduce the concept of network analysis. A network is a system of interconnected elements which are used for modeling transportation, rivers, utilities, etc. In section 1 of this lab we created a python script that would find active mines within Wisconsin that didn't have a rail loading station on-site and were at least 1.5 kilometers away from a rail line. In section 2, we used the mines that fit this criteria and used network analysis to route the sand from the mines to the rail terminal. The results from this were then calculated to see the impact that sand transportation has on roads. All of the results are hypothetical, but can give a good estimation of the costs.
Methods
For the second section of this lab we needed to find the quickest route from the sand mines to a rail terminal. Once we practiced with network analysis a bit, we realized it was quite easy to use. In order to make the lab more challenging, we were instructed to create it all in model builder. The first step was to create a Make Closest Facility Layer. This is the type of network analysis model we want to use in order to find the closest rail terminal for each sand mine. In order to do this we needed to add locations and make one layer the facilities and one layer incidents. In this case, the facilities were the rail terminals and incidents were the mines. In order to create the routes, the solve tool was used. The model was run and added to the map in order to make sure everything ran properly. Everything ran smoothly on the first try so it was time to move onto the next part of the model. Next we needed to use a model only tool called Copy Features. This is basically the same as exporting a selected feature in a mapping session.
Next we needed to project these new layers into a better coordinate system. Before the were in a coordinate system that used decimal degrees. We can't calculate miles from this so I projected all of the new layers into a better suited coordinate system for this project. In the model below in Figure 1, it only shows that wi_counties layer projected, but I also projected the other layers. I just chose to not include them in the model. Next we needed to calculate the total road length for the routes by county. This was done using the tabulate intersection tool. Once that was calculated I added a field in order to convert the measurements for each county from feet to miles. Next I created another field where I took the length in miles * 100 * 0.022. The 100 represents the yearly truck trips from the mine to the rail terminal. There are 50 yearly trips, but it had to be changed to 100 because the truck do round trips and not just one way. The 0.022 represents the hypothetical costs per truck mile which is $0.22. Once again, this model can be seen below in Figure 1.
 |
| Figure 1: The model used in order to calculate trucking impacts on roads. |
Results and Discussion
After the model was created I put together a map which shows the final results. This map is shown below in Figure 2.
 |
| Figure 2: Trucking routes between suitable mines and rail stations. |
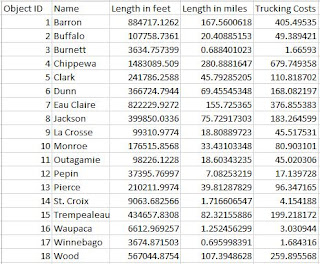
As shown above, not all of the routes are within the Wisconsin states lines, two of the routes let to Minnesota. Many of the routes also went to the same railroad station. In Figure 3 below, the length in feet and miles are calculated and it shows the final hypothetical trucking costs. In Figure 4 below the table, I created a graph in order to show which counties are causing the most damage to roads through trucking sand to the rail terminals.
 |
| Figure 3: Trucking lengths and costs for each county with a mine. |
 |
| Figure 4: Trucking costs per county. |
As seen above, Chippewa, Barron, and Eau Claire have the highest trucking costs. By looking at the map we can see that most of the mines and rail terminals are within or surrounds these counties. The impact that these trucks have on the roads and environment are causing quite a bit of damage. So we have to ask, is the damage worth it?
Conclusions
This was definitely one of the more difficult labs we've done. I took a lot of thinking about what tools need to be used and how to use them. Model builder made things more difficult, but I am glad I got the extra practise with it. As for the results of this lab, I was interested to see how much these trucking costs would turn out to be. It was no surprise that the costs were higher in more populated areas like Eau Claire. I just wonder whether these companies that are involved with sand mining know the damage they're doing to roads and the environment? I would like to know more about the sand mining industry after doing these labs. It seems like a huge industry, but are they helping or hurting the environment around them? It would be interesting to know.
Data Sources
Hart, Maria V., Teresa Adams, and Andrew Schwartz. "Transportation Impacts of Frac Sand Mining in the MAFC Region: Chippewa County Case Study." University of Wisconsin- Madison, 2013. Web.
Data Sources
Hart, Maria V., Teresa Adams, and Andrew Schwartz. "Transportation Impacts of Frac Sand Mining in the MAFC Region: Chippewa County Case Study." University of Wisconsin- Madison, 2013. Web.
No comments:
Post a Comment